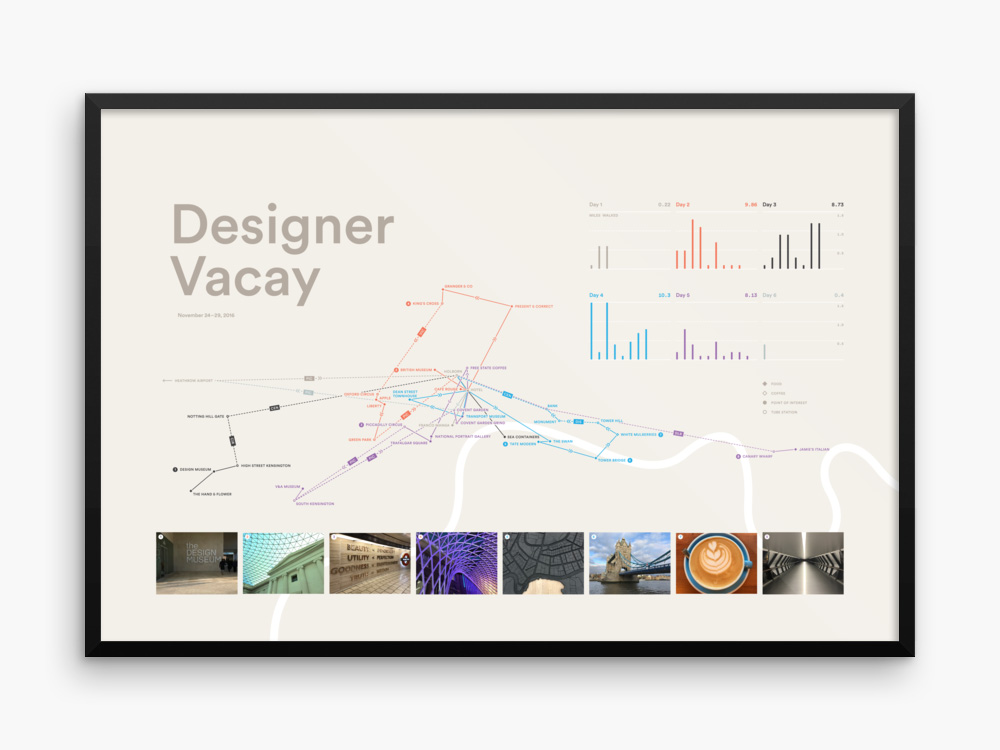
Designer Vacay
12 13 2016
What designer's vacation would be complete without a data visualization? As soon as we got back from our trip across the pond for the opening of the new Design Museum, we mapped every leg of every journey we took through London, both by foot and by tube, then calculated the mileage for each. No wonder we had to stop for coffee so many times!
The final piece nicely reflects the chaos of cramming everything we wanted to do and see into just four days.
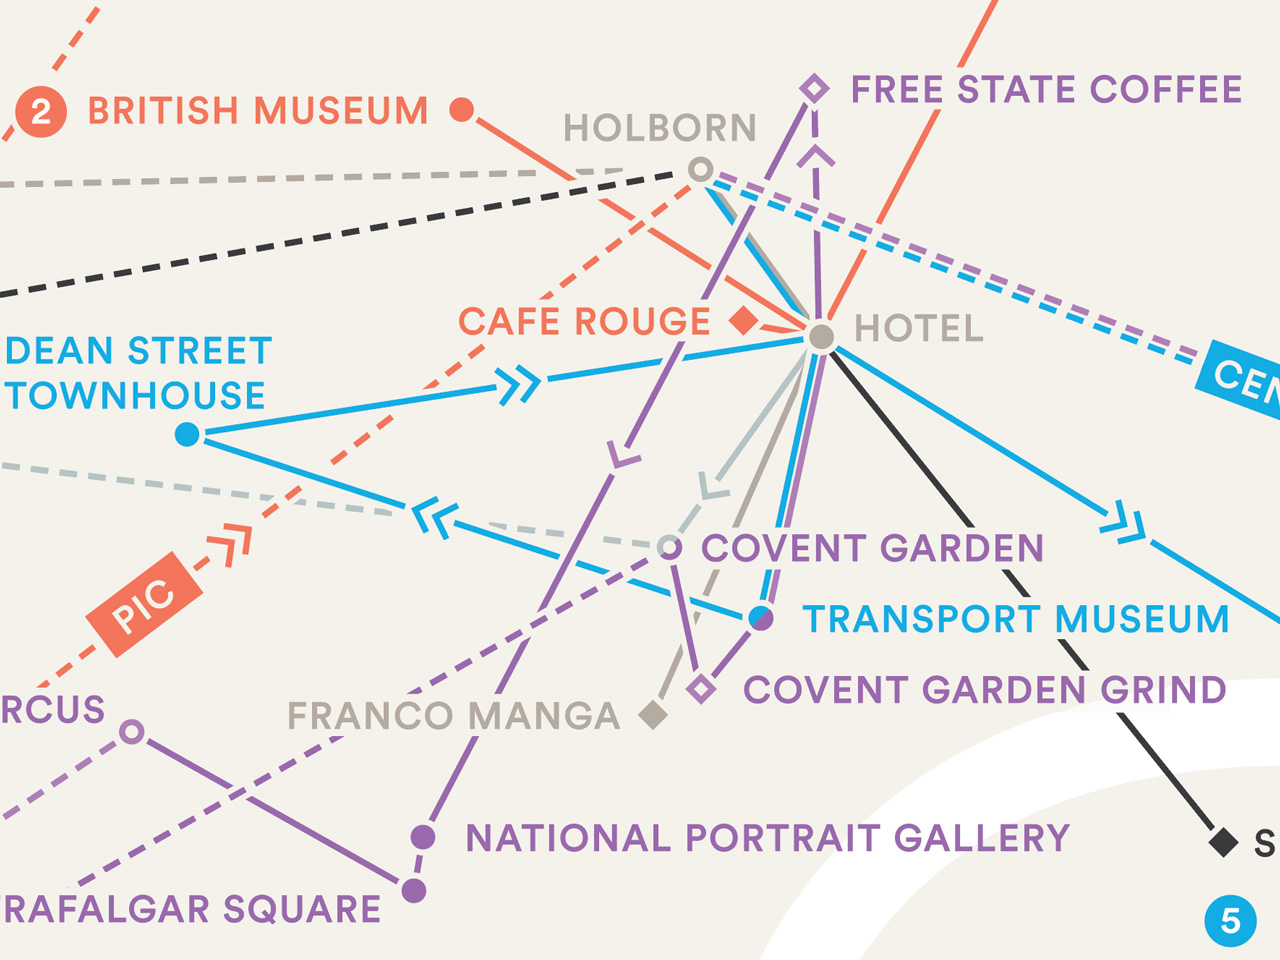
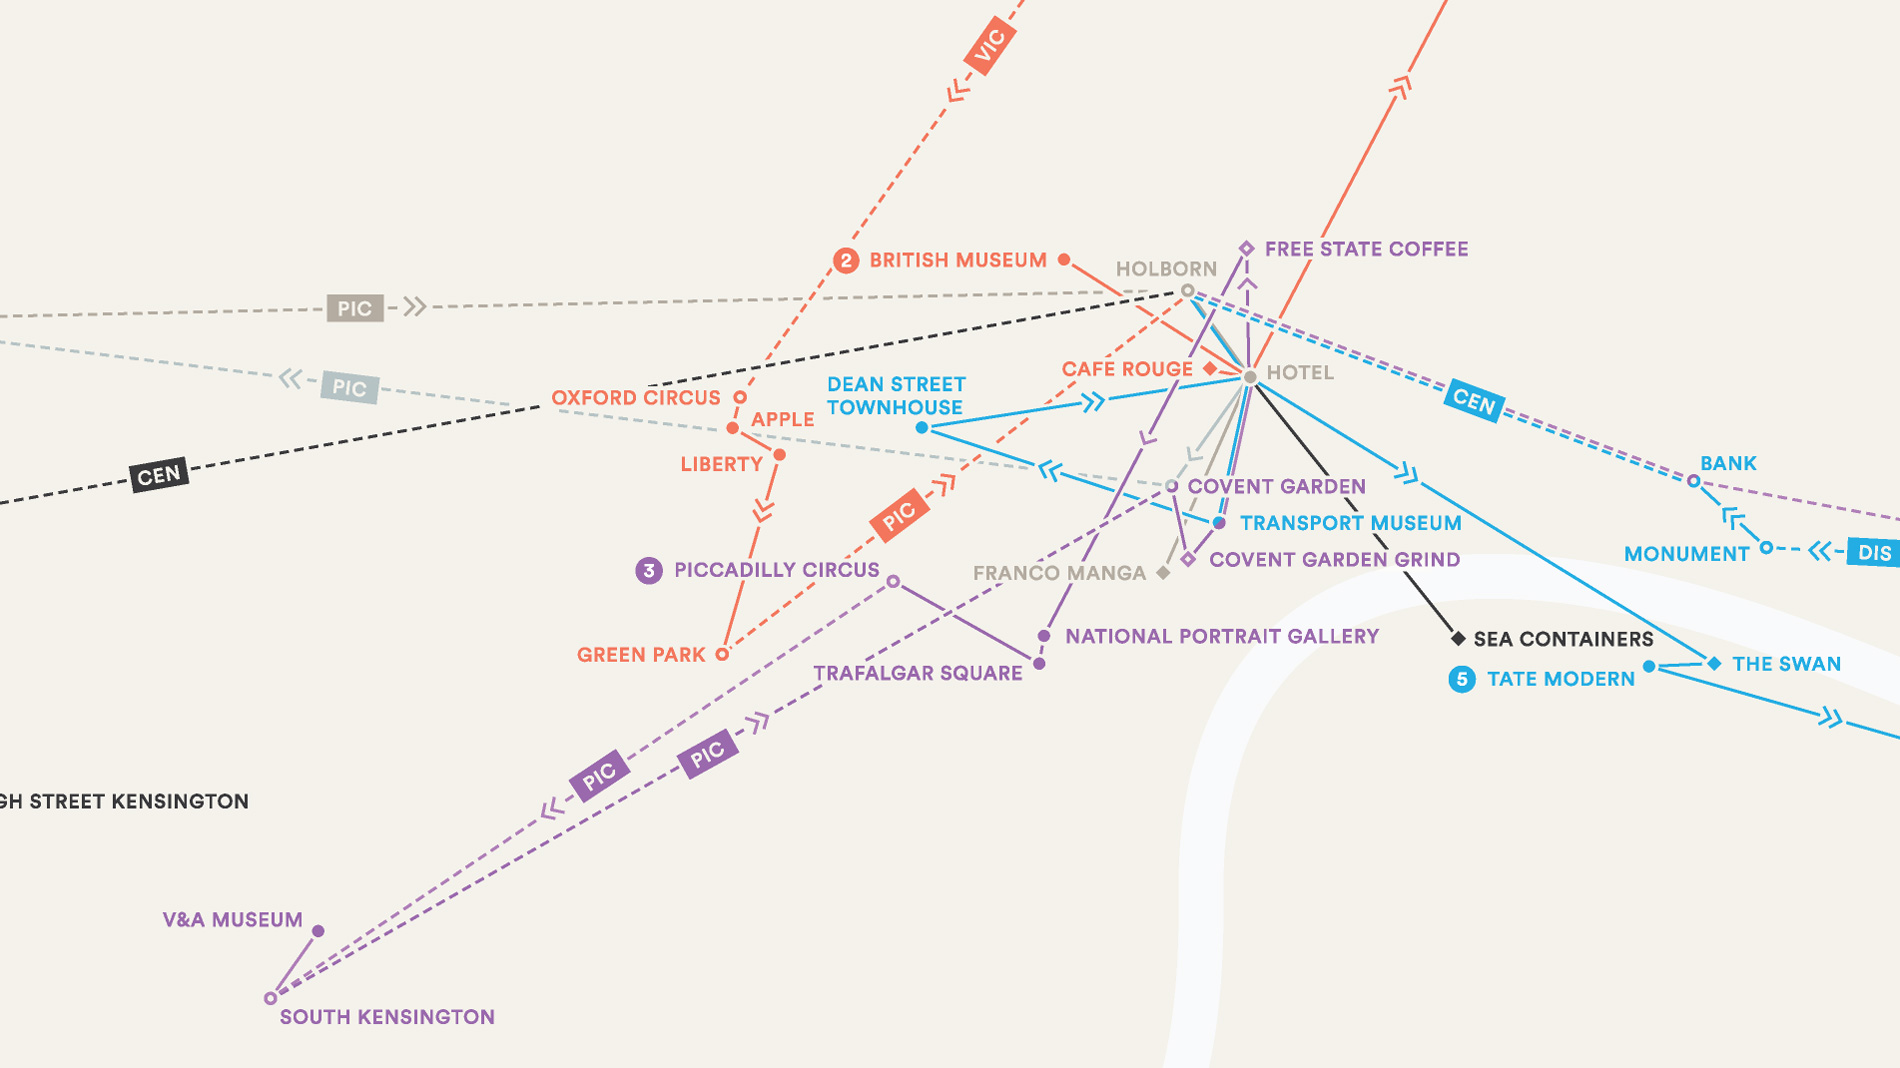
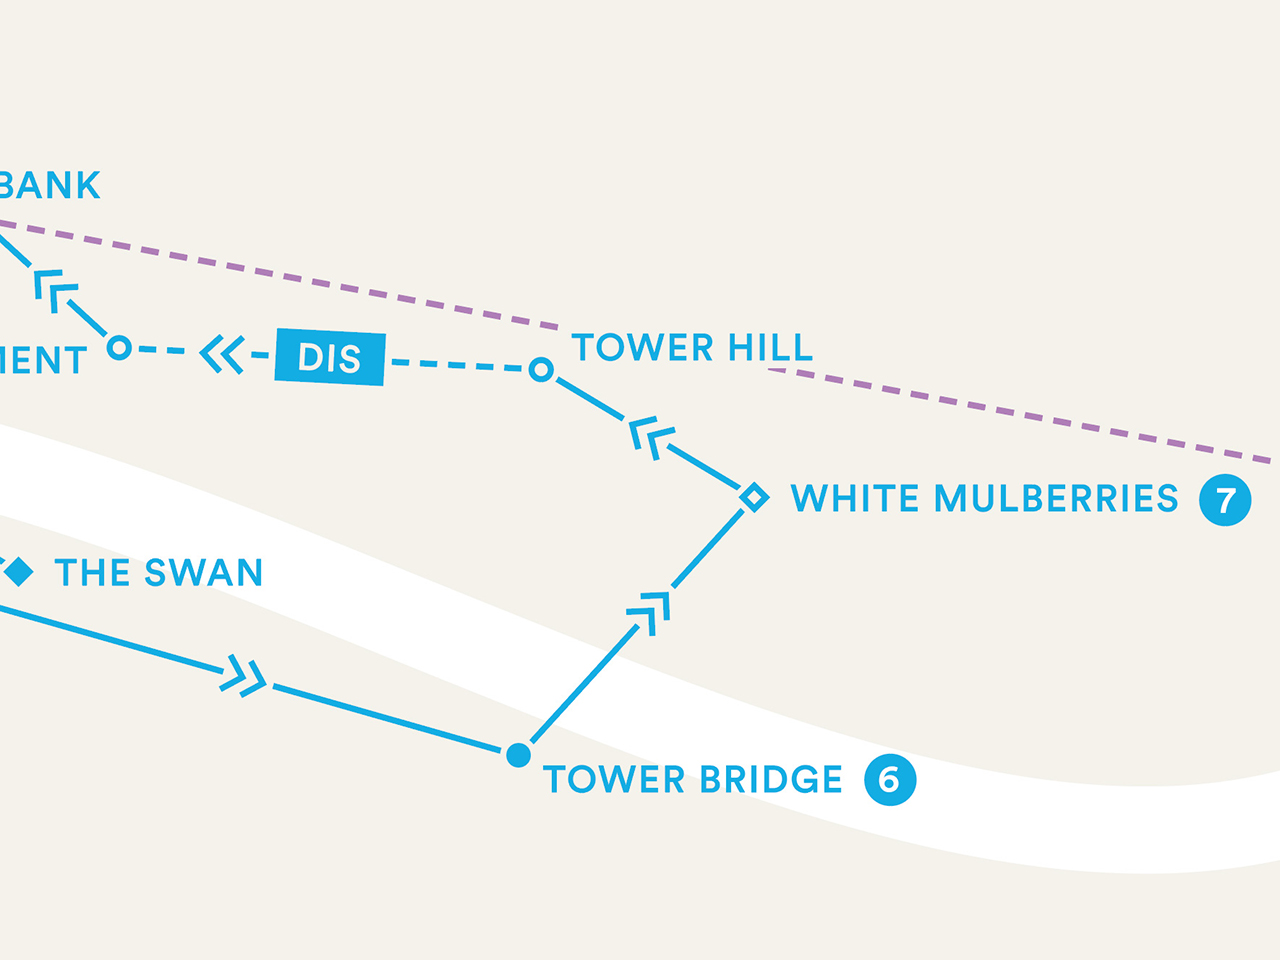
We started by marking each place we visited on a physical map, then digitally tracing over a map screenshot in Illustrator. We assigned meaning to every graphic element: solid lines represent routes we walked, dotted lines are trips on the Tube; solid dots symbolize points of interest, like museums, landmarks and shops, hollow dots are Underground stations; solid diamonds are restaurants and hollow dots are coffee shops.
Like the iconic Tube map, we used the river as a point of geographic reference for the places we visited and the distance we covered.
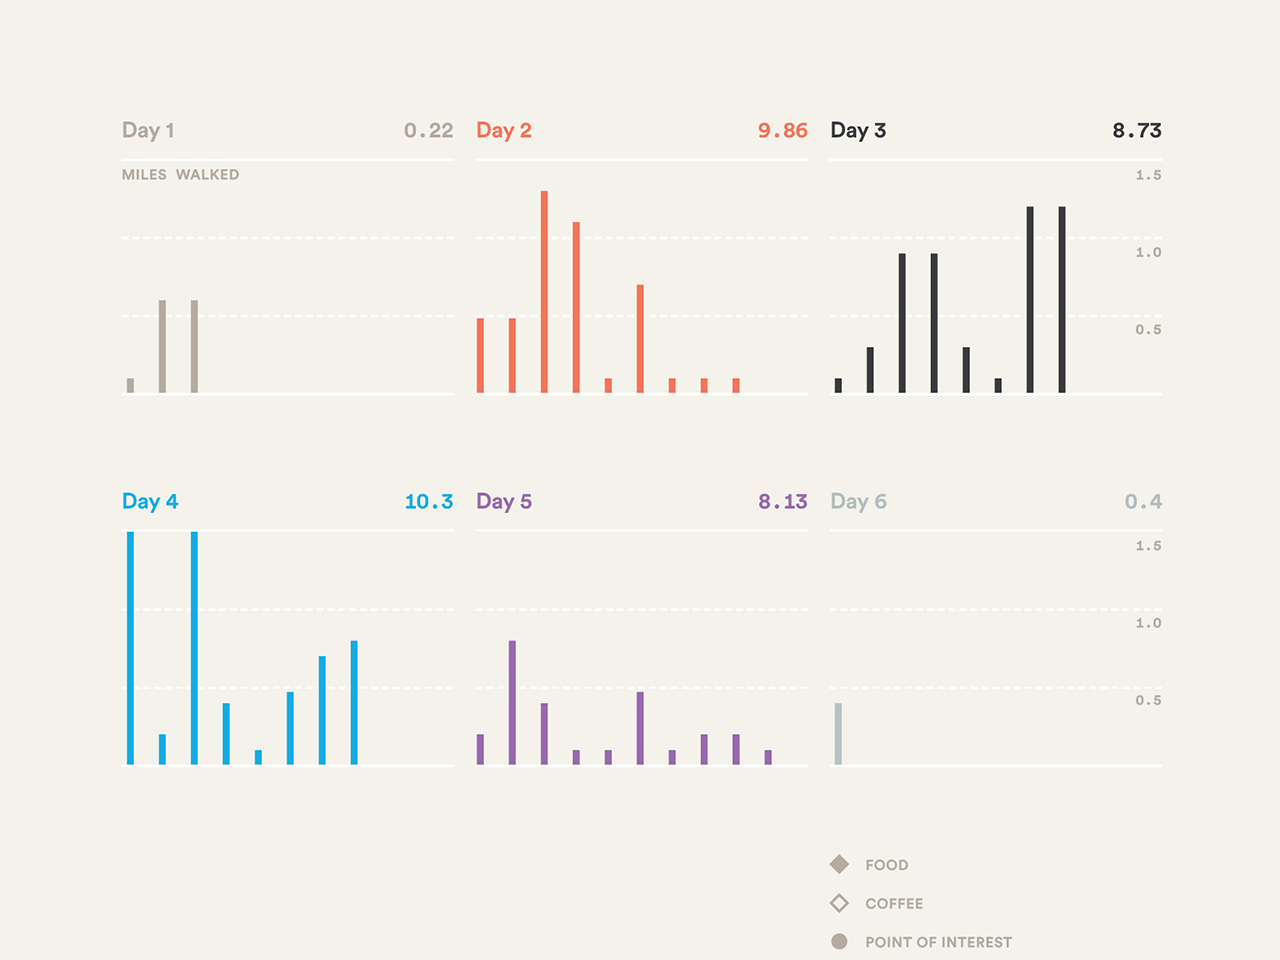
Each day of the trip is assigned it's own color, which coordinates with the graphs that show how many miles we walked. Each bar indicates a leg of a trip.