Sox Scores
Minimal visualizations of the final score of every 2017 Red Sox game.
Sox Scores explores the intersection of two of our favorite, but seemingly disparate, things: design and baseball. We find overlaps like these produce the most interesting results.
For every Red Sox game of the 2017 season, we created minimal visualizations of the final score. The complete season is collected in a 6x9-inch, 180-page, softcover, perfect-bound book. Indexed by date, game number, and opponent, with a special score cheat sheet.


We saw an opportunity for a less obvious and more artistic route by taking a minimal approach to data visualization — simply representing the number of runs scored with color.
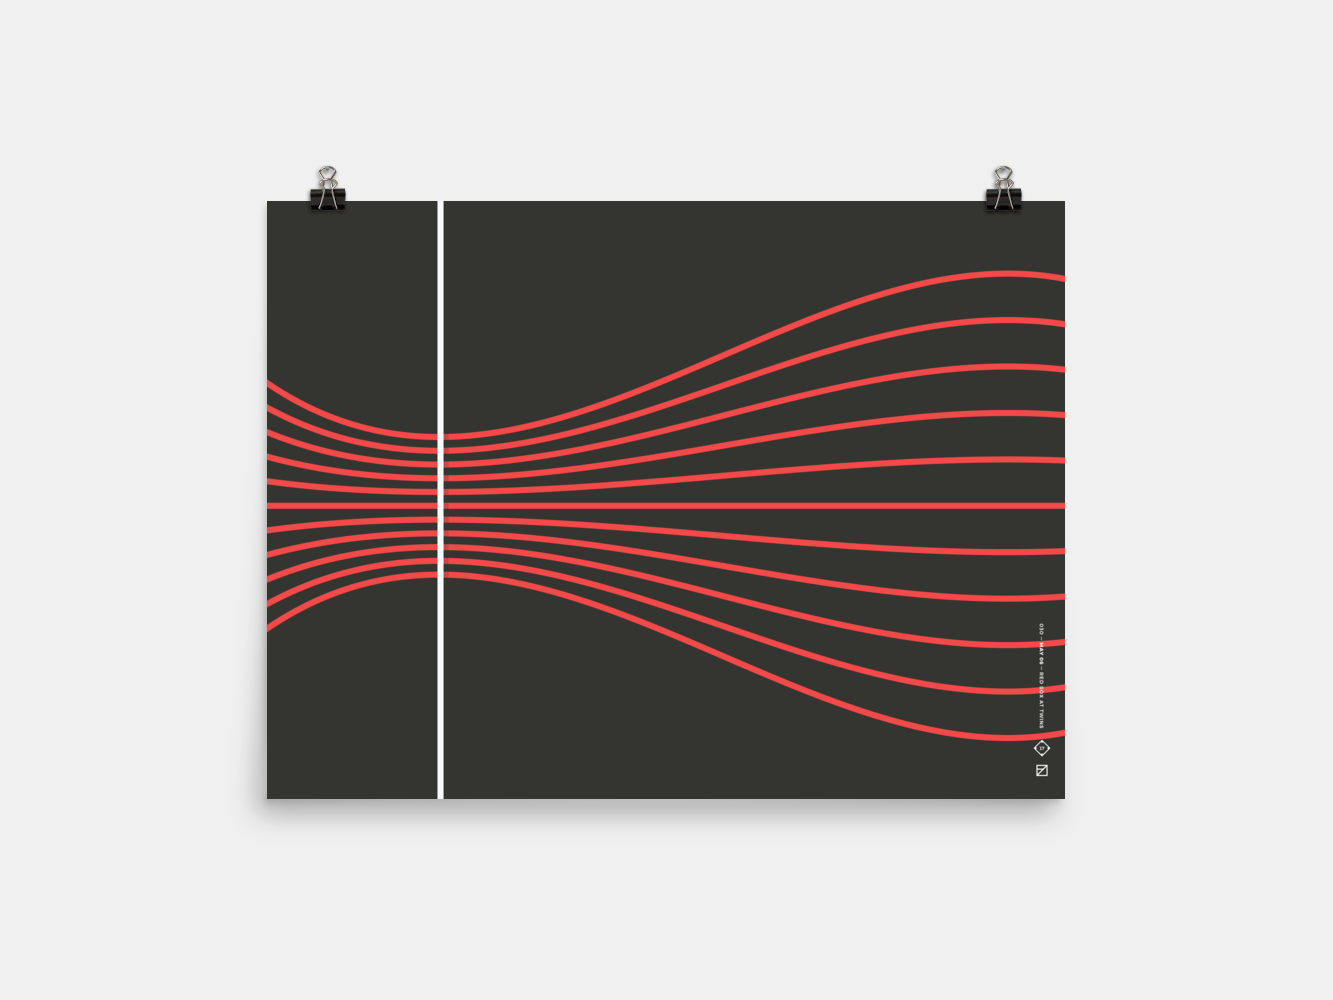
Each of the 166 visualizations was designed and published before the start of the next game, usually within less than 24 hours.

